Wednesday, September 21, 2011

Derived from "all the same market" CB continuous liquidity policy


When tech leads the broad market stocks are bullish in general terms. Here's the ratio chart, NAZ 100 priced in S&P 500. As long as this chart does not reverse into downtrend Bernanke is winning, and printing is working (to keep asset prices supported).


AAPL has been leading the NAZ, here's AAPL priced in NAZ 100


If this AAPL-NAZ ratio reverses it will probably reverse NAZ-SPX, and we will have an early warning that central bank policy is in trouble.

So even if gold starts to correct, as long as AAPL:NAZ uptrend remains intact, there is essentially nothing to worry about in terms of a long deflationary period taking root.

Wednesday, June 22, 2011

Term Deficit

Today I want to talk about inflation a little, and mention some problems we have in discussing it.

What is inflation? Well in ordinary terms it is the condition that occurs when an economy is growing, and wages and prices increase to keep up with growth. Eventually, if the economy is really "hot" (growing fast), a wage and price spiral occurs. At that point a natural upper limit occurs, and the economy reverses into deflation and recession while correcting imbalances that occurred in the boom period. This is the organic business cycle that has been repeating since the beginning of societies.

OK, but printing money, as our Fed has been doing, is also inflation. But that is a very different kind of inflation. Consider - central banks only "print" during slow economic times (to stimulate the economy). So how can you have inflation and a slow economy at the same time?

Well maybe you can't, and the "inflation" induced by printing is a misnomer, at least in classical terms. Printing does drive up prices: where one dollar becomes two, other things being equal, prices double. But if I break a pencil in two, I still have the same amount of wood and lead. Real wealth is not created, as in the case of inflation in an "organic" business cycle and growing economy.

Modern monetary practices are based on the fact that markets are in some measure determined by psychology - two half pencils "seem" like more than one whole one. Extrapolating the metaphor, the game has limits - pencil functionality is reduced, and repeated enough, destroyed.

To monetarists and central bankers, distinctly different terms for "induced" vs "organic" inflation would be conter-productive when the goal of "induction" is renewed confidence. Two distinct terms negate the psychologic effect.

But continuous pencil breaking destroys the thing they are trying to save. Central bankers are not immune to classic human foible, the desire for free lunch. There isn't one.

Monday, May 23, 2011

Elephants in the Brambles: There Ain't No Cure For Love

Fascists can try to control markets, communists can try to eliminate markets, but there is "nothing new under the sun", only new names for the same phenomena repeating over and over. And that repetition always gives rise to the collective feeling "it's different this time".

One wonders whether Karl Marx would have proposed the deliberate end of free markets if he had come after Freud instead of before. It seems to me the entire idea of communism is a classic example of Utopian Thinking, which is always based on the belief or wish that reason is stronger than instinct. Which is a bit like saying the house is stronger than the foundation - you see what I mean? - at best a false dialectic, at worst dangerously wrong.

So. The latter half of my title borrowed from the title of a Leonard Cohen song, his poetic way of saying the instinct complex does not succumb to legislation. Or, biology isn't a negotiation, it is given, not invented. Marx might have at least considered this idea before giving himself over to Utopian Idealism if he had "read his Freud".

But he didn't, that would have been too easy, and as usual the progression of history (and herstory) is rather a mess. But it is as it should be, and is supposed to be, as it is the ongoing process of the biological, of which we humans are a full part, Freud's essential contribution, if we may boil it down to the one most important thing. We always find the way to deny the implications of "full", as the implication is not at all comfortable. Freud again: All neurosis is born in the instinctual fear of death.

One might say the Utopian Notion is equal to and the exact same as the notion we can and will rise above biology, our foundation, without the parametrics of that biology imposing limits. But the reality is a given foundation supports a certain load, and no more.

The markets, being an essential element for the condition of society, are interesting. They are continually being meddled with by the idealists (legislators), and the thieves (speculators). This is a stasis ripe with irony and paradox: many of the idealists are thieves in a state of rationalized self-delusion (regulators cum robber barons), and many of the thieves are the "healthy flora" of the gut, necessary for whole and healthy function.

In communism - the elimination of free markets and implementation of state planned production and distribution - there is no way for markets (society) to "find their way", as the model arbitrarily imposed on the biological condition is (infinitely?) too simple. Real (so called black) markets erupt spontaneously, else the biological condition would have nowhere to go, and in the form of that entity, it would die.

In fascism - the denouement phase of an established political order - we again find sweet irony and paradox: the market that is assured by the establishment to be safe may in fact be the most dangerous of all. It is the market wearing the assurance of health that is in fact a system in collapse and fighting for life. The collective immortality self-delusion becomes the danger to participants in that market, one can never be sure of survival (much less health) at the critical juncture. But we, being biological, will fight, then fight some more.

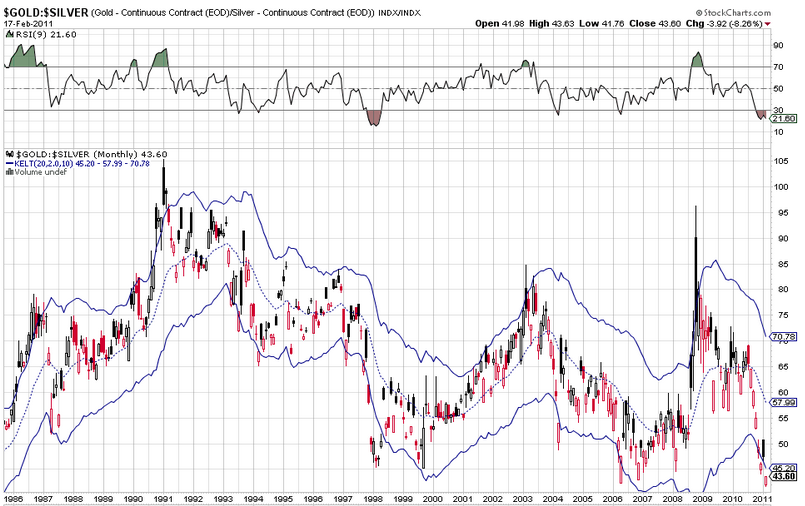
And the markets go round and round the merry. First the patient crashed, then was saved, then put on meds, then jump started with stimulus - a few times already! Can the patient be stabilized? It seems to have come back from death's door and emerged from coma. Or is that just the ventilator doing it's thing? Can it stand on its own two feet? If so that (crash and recovery) V on the chart is just an anomaly. We shall see, but in larger context it will probably take a few more years more to know.

Bear Markets

You may find this chart interesting (below, click for bigger), showing the previous bear market, duration approx 17 years early '66 to late summer '82. Bear markets tend to last 20 years mas o menos. This one started in '00 and is thought to be worse than the 70's bear, being the "correction" pattern of the entire growth cycle from the end of the depression bear market. That fits the fundamental reality with Europe, Japan, and US all having "default" levels of debt weighing down growth (not the case in the 70's bear).

The question becomes is the worst over, or to come? The universally denied higher probability is (in my opinion) "to come". Governments will try to prevent and avoid, the question then becomes how desperate will they get? Established political orders are literally fighting for their lives, it is just not completely obvious yet.

This economic depression (corrective cycle) is very possibility bigger than the so called Great Depression. Fundamental economic conditions across the developed world certainly support that view. Counter to that view is govts saying "hey don't worry, we got this!" OK.


Sunday, May 8, 2011

A "Real" Inflation/Deflation Indicator

There are several metrics used to reveal levels of economic activity. Some of the more accurate are said to be consumed levels of the fuel and construction commodities, in particular crude oil, copper, steel, aluminium, lumber and the like. Of these, consumed levels of crude oil is said to be the most telling.


Aggregate global consumption of any commodity is difficult to calculate, so economists like to use price as an indicator, since rising and falling price will directly reflect demand.


But first I think we have to ask and answer the questions, what gives an indicator it's value, and what makes it accurate?


Obviously, for it to have value, it has to measure something of relevance. Less obviously perhaps, for it to be accurate, it has to make that measure using a method of the highest signal to noise ratio possible. The less relevance or accuracy of the indicator, the lower it's value.


I'm going to stipulate that crude oil priced in gold is the most relevant and accurate price based indicator of aggregate global economic activity we currently have at our disposal. We don't want to use crude priced in US Dollars because USD has become very problematic as a measure of any fundamental economic condition. USD has a very low S/N ratio, caused by a lack of "anchor": since it can and is being printed with no regard to underlying economic activity, it is very "noisy" as a measure of said activity.


To digress a bit, I would say the dollar's only useful measures are twofold: how quickly it multiplies against itself, ie how fast is it being printed, and whether it can mount anything more than "snapback" (reaction) rallies as it continues a secular decline in value (purchasing power). In other words, it's most useful measure is now only whether we have entered into a run-away spiral (hyper) phase in the economy in either the direction of inflation or deflation. Other than those gross (but potentially useful) measures, it is mostly "noise".


To get back to the main point, the case for using crude priced in gold as a measure of aggregate economic activity has multiple elements: 1. the aggregate use of crude is thought to be the most accurate measure of activity, 2. price is thought to be the most accurate measure of demand, and 3. gold has become, by virtue of the incredibly high "noise" levels in USD (in particular since the onset of the "long crisis"), the most trusted functional currency.


And since oil and gold are both priced in USD, by pricing either in the other we completely eliminate whatever "noise" the dollar would contribute to the final measure.


In addition, a secondary but not insignificant point, is that both crude and gold are considered "alternate" currencies to USD, because of the noise issue with USD. This cancels the potential for gross out of phase characteristics. In other words we are comparing variations on a theme, or apples to apples.


So what we are left with is perhaps the best single measure of true savings vs true spending on the global aggregate scale. And since the impulse to "save" is the key deflationary force, and impulse to "spend" is the key inflationary force, we have a true measure of direction of inflation/deflation on the global aggregate level.


Bottom line: if price of crude in gold is moving up we have a condition of aggregate global inflation, and vice versa. Here is a an example chart (click for larger) of what that looks like on a monthly time frame.

Thursday, April 7, 2011

The Wealth Effect

Why has our economy needed so much stimulus  since the crash of 1987? Why are we having one financial crisis after another, each requiring massive stimulus to "jump start" the economy again?


The short answer is the real wealth of the USA is decreasing, and we are fighting that trend for all we are worth. The primary way we fight that trend is increasing the money base. Money is easy to increase (just "print"), but wealth is a mix of resources, innovation, and infrastructure, so increasing (or decreasing) wealth is a long term process. Money is just slips of paper that represent wealth, the medium of exchange a complex economy needs to function efficiently.


First things first - why is the real wealth of the USA decreasing? The basic reason is resources, and the end of "cheap" domestic sources of oil. Oil, more than any other natural resource in or on the earth, is a potent creator of wealth. It runs everything in modern civilization. We (USA) hit peak production of it in the 1970's, which caused depressions at the time in the local economies of Texas and Oklahoma. We used to export the stuff, which created vast revenue for the USA, but now we import 70% of the oil we use domestically from other countries.


The goose that laid the golden egg died of natural causes.


So we have been replacing real wealth creation with "the wealth effect", which is simply the idea that stimulus of the economy creates economic activity, which creates wealth. The problem is that while it does create activity, instead of real wealth stimulus creates debt. And of course debt is a claim on real wealth.


It works like this: an entity with falling revenue cannot keep pace with expenses. If it borrows money, it will spend it, stimulating the broader economy. But the entities debt has gone up, and unless it comes up with a way to increase revenue the best it can hope to do is service that debt. If it's revenue does not rise it will also have to borrow more eventually. It can play this game as long as it can beg, borrow or steal additional money.


If the entity is a country that prints it's own money, it can in effect "steal" the money. Just print more and pay off the debt with new money, hot off the press. The problem is this creates inflation for the citizens, which is a tax on citizen revenue, and a real decrease in citizen real wealth.


All this comes down to one thing: excessive debt creates instability and potentially conflict (somebody wants to get paid!), and the so called wealth effect we have been running our economy on for decades really only replaces lost revenues with increasing debt.

Saturday, April 2, 2011

The Value of Your Dollars is Going to Debasement

Well we are seeing an unusual situation where the ratio of how many ounces of silver we can buy with 1 ounce of gold has continued to drop pretty quickly. The chart below is the update as of this weekend (click for bigger). It is currently at a ratio of about 1:38, which simply means that is how many ounces of silver you can buy with 1 ounce of gold. In my Gold! No wait, silver! Feb 20 post the ratio was about 1:44.


I've noticed when prices or ratios get out of the average range (the blue band that the ratio usually stays within) as they are now, what typically happens is a "correction to the mean", ie the ratio comes back within the band. Another thing I've noticed is when prices or ratios come way out of range they tend to correct to the mean by going outside the band in the opposite direction. Notice the black bar going way out of the top of the band in the latter part of 2008? That was the financial panic and market crash of 2008 when folks were loading up on gold way more than they were buying silver. We seem to be correcting that "imbalance" of the mean by going outside the band on the other side.


The reason the ratio of gold to silver price spiked to about 1:97 in the 2008 crash is because when people are panicking about their net worth rapidly declining (crashing) they want gold as the safe haven. Of course, more purchases of gold drives its price up, and less purchases of silver drives it's price down.


The reason people wanted gold during a financial panic is because throughout history gold has been thought of as the most stable "store of value" available. Even as it's price in US Dollars fluctuates, what you can buy at any given time with an ounce of gold (converted into dollars at the moment of purchase) actually does not fluctuate all that much. That stable "value" of gold has been an ongoing historic phenomenon since Roman times.


Back in the old days when gold coins were the primary form of money being used, governments in debt trouble (because they spent more than they were bringing in) would often add some type of base metal to the gold coins but not change the nominal value of the coin. It was (and is) called debasement of the currency. However folks with product and services to sell would quickly discern the ruse and demanded more of the debased coins for the same product/service. All they really asked for was the same amount of gold as before.


Shrewd business people aren't fooled by debasement of currencies by governments trying to wiggle out of their debt responsibilities, and so they ask for more of the debased currencies in proportion to the level of debasement. A coin debased of all gold content would only be worth whatever the copper or bronze was selling for on the market at that time. Whereas a Roman citizen may have only needed a few dozen gold coins for a nice new chariot, they would have needed a wheelbarrow full of them when they were fully debased.


Of course modern governments decided they didn't want to have to be enslaved by "honest money" (gold) so they completely debased the currency in perpetuity by removing the convertible feature whereby your paper money could be converted directly to gold or silver. A dollar was redeemable for one ounce of silver (the silver dollar).


When paper currencies are completely unlinked what are they worth? The "full faith and credit" of the issuing government. But what if that government is in debt up to it's eyeballs, more than they are taking in, so much they cannot even keep up with the interest payments on what they owe? How much faith are shrewd business people going to have in the paper money issued by that government?


Then, if that weren't enough to erode "faith", that same indebted government decides to just create more money so that they can at least keep up with interest payments. They have to do that or the government cannot borrow new money to cover ongoing and increasing expenses, and then that government will cease efficient functioning. And after all since the paper money is not linked to anything of stable value, all they have to do is print more of the stuff.


There are other things of stable value, a given quantity of food can be exchanged for a given quantity of clothing, for example, on a barter, and that relationship is historically stable. The value of gold as money has a lot to do with it's relative durability, and portability.


Yes, it is true, governments are comprised of people, and so like individuals are capable of engaging in wishful thinking. When this happens, but shrewd business people aren't fooled, and the government prints more and more to keep up with ramping costs, a runaway spiral can start.


Well guess what there's an easy way to keep track of the level of wishful thinking a government is engaged in regarding it's net worth, and the subsequent ongoing value of the "faith" held in it, by simply looking at the value of gold, in comparison.


Gold doesn't really change in value in terms of what can be procured with an ounce of it, but the dollar does, the value of paper money only goes down! This is another thing that has always been true throughout history. So, as the value of the dollar goes down, the price of everything else goes up. But you can measure the change by seeing the change in stable value gold. If the price of gold doubles in three years, the value of the dollar halved in that same time. This correlation is not exact moment by moment, but averages over time.


Here's a picture of the ratio of dollars to gold, or in other words, the decline of the purchasing power of the dollar. Since about the time of the market crash of 2000 (tech wreck), the US gov began debasing dollar value by printing more of them, in an attempt to keep up with the existing and new debt necessary for continuing gov operations.


Sunday, February 20, 2011

Gold! No wait! Silver!

In the good old days, you could traditionally buy 16 oz of silver with one oz of gold. Right now you get 43 ozs of silver, making silver seriously cheap in historic terms. Many market and economy watchers think this ratio will return to 16:1 or thereabouts before this is all over, several years down the road.


Here's the chart I use (click for bigger version) to check where we are in the ratio of gold to silver. At the time of this chart, it was 43.60 to 1, the number on the lower right in the little box in bold type.


This chart is also perhaps the most sensitive indicator of speculative fervor I know, because gold is a "savers" vehicle, whereas silver is a "speculators" vehicle, and saving and speculating are diametrically opposed impulses. On this monthly chart (each "bar" represents one month) it's clear for the past 7 months speculative fervor has been quite high (because the price of gold is dropping rapidly, relative to silver - red bars are dropping, black bars are rising).


Since this chart is gold priced in silver, when the "relative strength index" (at the top) is in the green zone it means gold is overbought (expensive) relative to silver, and in general it is "time" to buy silver. The inverse is also true, when the RSI is in the brown zone it is time to sell silver. The blue lines "channel" around the ratio is basically redundant to the RSI, but it does indicate extreme conditions when the ratio exceeds the band by a lot. When that happens things have gone too far out of balance, and a "means reversion correction" of that imbalance is coming.


So why does "speculative fervor" matter? Everywhere you turn you hear "buy gold" right? Why not just do that and be done with it? Well, if silver is going to go up more than gold, you may want to know when particularly good times to buy silver occur. There's an old saying in real estate, you make your money when you buy, not when you sell. It's true for any investment in any market.


So why, if the RSI is currently in the brown zone why would I be saying "buy silver"? Because if the ratio does go back to 16:1, trying to "trade" silver may be more work than necessary.


So then what to do? Find a local coin dealer and buy a silver coin a week, and don't worry about the silver gold ratio at this point. Or maybe double up on your weekly savings when it's in the "buy zone" (green on the RSI). Or if you want to buy in larger quantities, begin buying small amounts weekly to get in the habit of watching this chart, then pounce when the pouncing is good. Start saving, but not dollars! Dollars represent continuing reduction in purchasing power.


Consider: In the 1950's a gallon of gas was 15 cents. One could buy a gallon of gas with either a paper or silver dollar, they were the exact same unit of exchange, and silver dollars were still in circulation. A buck bought about six and a half gallons. Today a gallon is what four bucks? A dollar will buy one quarter of a gallon. Take that same silver dollar to a coin dealer and convert it into today's dollars and you get about $30 currently. Today's silver dollar buys seven and a half gallons.


This "inflation" relationship, and the debasement of the paper dollar, applies to everything we buy, and is now in extreme acceleration due to extreme levels of dollar "printing". So it represents an opportunity to move dollars to silver, in a gradual enough way so as not to "crimp" necessity purchases too much, but constantly enough to make a real difference in your situation.


If and when the ratio gets into the 20:1 range you may want to convert some of those savings back into cash, and pay down a mortgage, for example. If you are lucky enough to be debt free, buy stocks, because as the gold silver ratio returns to historic averages (or surpasses them) it will be a good time for stocks again. But don't buy stocks when the Federal Government is printing the crap outta the dollar!


So how could the historic 16:1 ratio be exceeded? The most basic economic relationships are way out of whack, at historical extremes all over the developed world. As governments try to keep things out of whack (what they consider normal, another story), and inflation begins ramping faster as a result, people will increasingly want to get out of "falling dollars", and since more people can afford silver than gold, demand (and price) for silver will skyrocket much faster than gold.


Here's a link to the same chart with a very important difference, it updates in real time automatically, on a weekly scale instead of monthly. I prefer monthly for overview, but the the weekly chart is free, the monthly chart requires a subscription to that particular charting service.

Friday, February 18, 2011

Picking Tops is Harder Than Picking Bottoms

(and both are harder than trend trading, but that's a different story)

1. People hate to lose money (because money equates to power and freedom) and will therefor fight tooth and nail not to, so;

2. All “critical” markets have always been and always will be protected from decline to whatever degree possible and deemed necessary by the principle participant group, so;

3. Technical methods of projecting bottoms in markets will therefore tend to be more precise than those same methods used to project tops, also giving rise to the shop worn stock market aphorism, “tops are a process, bottoms are an event”.

In other words, rich or poor, people are always looking to keep what they got, so market tops are gradual affairs that are "fought", forming a dome shape on the charts. And people are also always looking to increase wealth when they can, and everybody loves a bargain, so market bottoms bring out legions of bargain hunters, and form a V shape on the charts. (click for larger)


Stocks Only Go Up

Our current establishment is trying very hard to "guarantee" that the stock market only goes up (and does not go down, in a repeat of one of mankind's enduring follies).

It goes without saying (doesn't it?) that these are not "free market" conditions, and in general it is more difficult to "make money" in a centrally controlled market than a free market.

Why? The problem is there is only one mechanism capable of guaranteeing a stock market does not go down, and that is to "force" inflation by "printing" the base currency in sufficient amounts to "do the deed". (click for larger)


The problem with that is the "real wealth" (buying power of net assets converted to cash) of the average conservative investor will diminish even as stocks go up, because in the longer run, conditions of "induced" inflation will cause base currency to devalue more than stock indices increase in value. You can see the effect of such inflation on the chart below of the Dow index priced in gold, which simply shows in numeric terms how many ounces of gold it would take to buy 1 unit of the Dow. (click for larger)


Hummm, the price of stocks (their value) compared to value of gold topped out in 1999, and it has been consistently downhill since! This is an excellent general measure of the very real inflation induced by the ongoing historically high rate of "printing" dollars.


The term caveat emptor comes to mind.

Thursday, February 17, 2011