Here's the chart I use (click for bigger version) to check where we are in the ratio of gold to silver. At the time of this chart, it was 43.60 to 1, the number on the lower right in the little box in bold type.
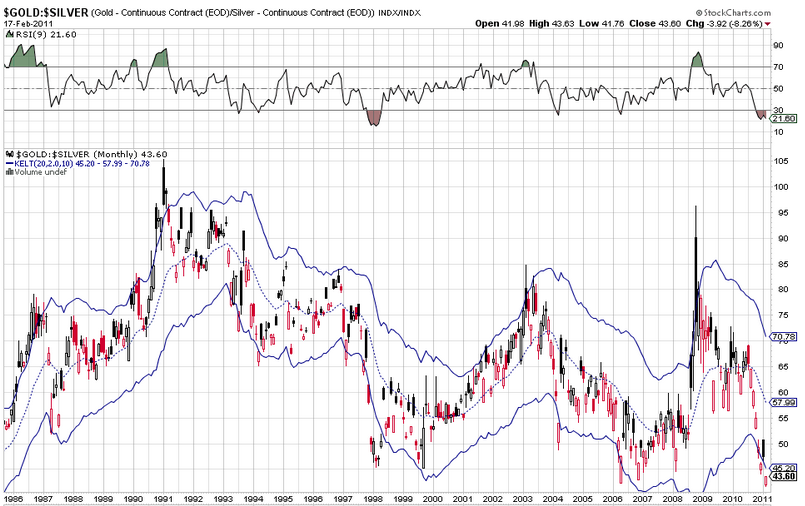
This chart is also perhaps the most sensitive indicator of speculative fervor I know, because gold is a "savers" vehicle, whereas silver is a "speculators" vehicle, and saving and speculating are diametrically opposed impulses. On this monthly chart (each "bar" represents one month) it's clear for the past 7 months speculative fervor has been quite high (because the price of gold is dropping rapidly, relative to silver - red bars are dropping, black bars are rising).
Since this chart is gold priced in silver, when the "relative strength index" (at the top) is in the green zone it means gold is overbought (expensive) relative to silver, and in general it is "time" to buy silver. The inverse is also true, when the RSI is in the brown zone it is time to sell silver. The blue lines "channel" around the ratio is basically redundant to the RSI, but it does indicate extreme conditions when the ratio exceeds the band by a lot. When that happens things have gone too far out of balance, and a "means reversion correction" of that imbalance is coming.
So why does "speculative fervor" matter? Everywhere you turn you hear "buy gold" right? Why not just do that and be done with it? Well, if silver is going to go up more than gold, you may want to know when particularly good times to buy silver occur. There's an old saying in real estate, you make your money when you buy, not when you sell. It's true for any investment in any market.
So why, if the RSI is currently in the brown zone why would I be saying "buy silver"? Because if the ratio does go back to 16:1, trying to "trade" silver may be more work than necessary.
So then what to do? Find a local coin dealer and buy a silver coin a week, and don't worry about the silver gold ratio at this point. Or maybe double up on your weekly savings when it's in the "buy zone" (green on the RSI). Or if you want to buy in larger quantities, begin buying small amounts weekly to get in the habit of watching this chart, then pounce when the pouncing is good. Start saving, but not dollars! Dollars represent continuing reduction in purchasing power.
Consider: In the 1950's a gallon of gas was 15 cents. One could buy a gallon of gas with either a paper or silver dollar, they were the exact same unit of exchange, and silver dollars were still in circulation. A buck bought about six and a half gallons. Today a gallon is what four bucks? A dollar will buy one quarter of a gallon. Take that same silver dollar to a coin dealer and convert it into today's dollars and you get about $30 currently. Today's silver dollar buys seven and a half gallons.
Consider: In the 1950's a gallon of gas was 15 cents. One could buy a gallon of gas with either a paper or silver dollar, they were the exact same unit of exchange, and silver dollars were still in circulation. A buck bought about six and a half gallons. Today a gallon is what four bucks? A dollar will buy one quarter of a gallon. Take that same silver dollar to a coin dealer and convert it into today's dollars and you get about $30 currently. Today's silver dollar buys seven and a half gallons.
This "inflation" relationship, and the debasement of the paper dollar, applies to everything we buy, and is now in extreme acceleration due to extreme levels of dollar "printing". So it represents an opportunity to move dollars to silver, in a gradual enough way so as not to "crimp" necessity purchases too much, but constantly enough to make a real difference in your situation.
If and when the ratio gets into the 20:1 range you may want to convert some of those savings back into cash, and pay down a mortgage, for example. If you are lucky enough to be debt free, buy stocks, because as the gold silver ratio returns to historic averages (or surpasses them) it will be a good time for stocks again. But don't buy stocks when the Federal Government is printing the crap outta the dollar!
So how could the historic 16:1 ratio be exceeded? The most basic economic relationships are way out of whack, at historical extremes all over the developed world. As governments try to keep things out of whack (what they consider normal, another story), and inflation begins ramping faster as a result, people will increasingly want to get out of "falling dollars", and since more people can afford silver than gold, demand (and price) for silver will skyrocket much faster than gold.
Here's a link to the same chart with a very important difference, it updates in real time automatically, on a weekly scale instead of monthly. I prefer monthly for overview, but the the weekly chart is free, the monthly chart requires a subscription to that particular charting service.
No comments:
Post a Comment